As one of the most requested features we are happy to officially introduce the Uptime and Response time graphs.

Setting up an uptime graph requires zero configuration, it’ll be added automatically to your status page (for startup & business subscribers) and you can choose to hide it in the design page of your admin panel.
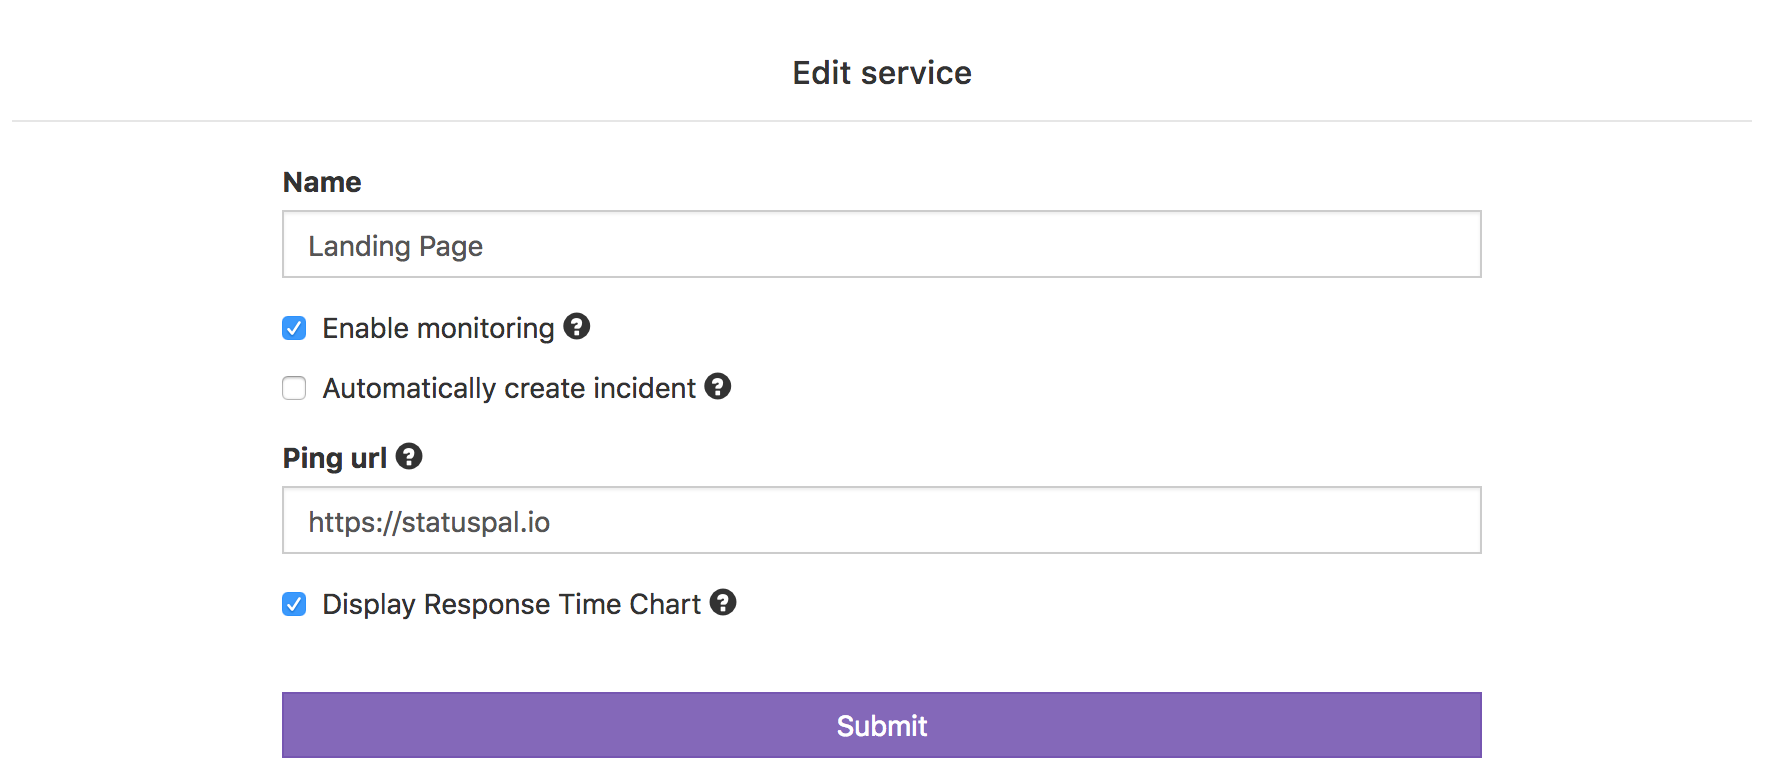
To display a response time chart you just need to enable monitoring in one of your services and leave the “Display Response Time Chart” field checked:
The response time will be displayed in your status page displaying data from the last 60 days including today.
Go ahead and give it a try at https://statuspal.io.